Simulation debug features
Open waveform in viewer
For all supported waveform type, Diplomat provides a shortcut to directly open the waveform in the appropriate external viewer.
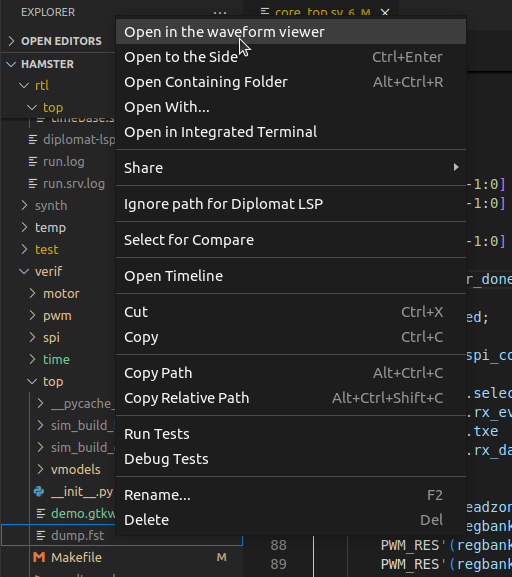
Open waveform menu
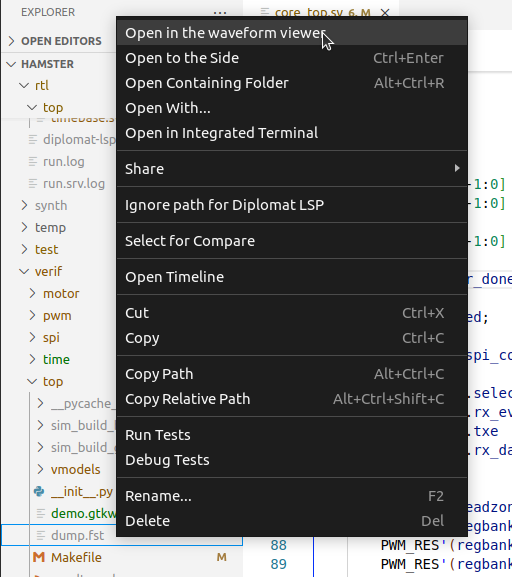
Open waveform menu
Note
As of today, only GTKWave 3 is supported
Hierarchy explorer
Once the workspace has been properly analyzed, the hierarchy explorer will show the hierarchy tree of the workspace. If no top-level file is selected, all potential top-level modules will be shown in the tree.
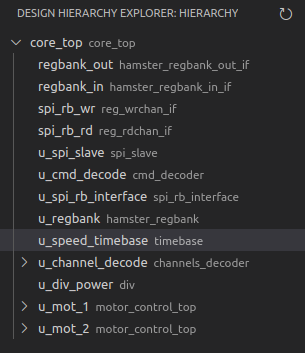
Hierarchy explorer view
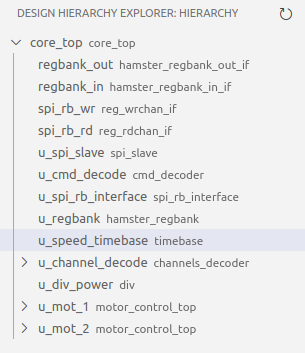
Hierarchy explorer view
Selecting an element in the hierarchy explorer will open the appropriate source file and select the instance for the Inline value display, if enabled.
Inline value display
Diplomat Client is able, under some conditions, to display the value from a simulation within the source code. This is done when:
A simulation which top-level module matches the workspace top-level is opened through Diplomat Client action.
A hierarchy level is selected in the Hierarchy Explorer
Once those conditions are met, the editor will display the simulation values for the selected time directly in the editor. Changing the position of the marker will update the values in the editor. The traces does not need to be displayed in the viewer for the values to be retrieved.
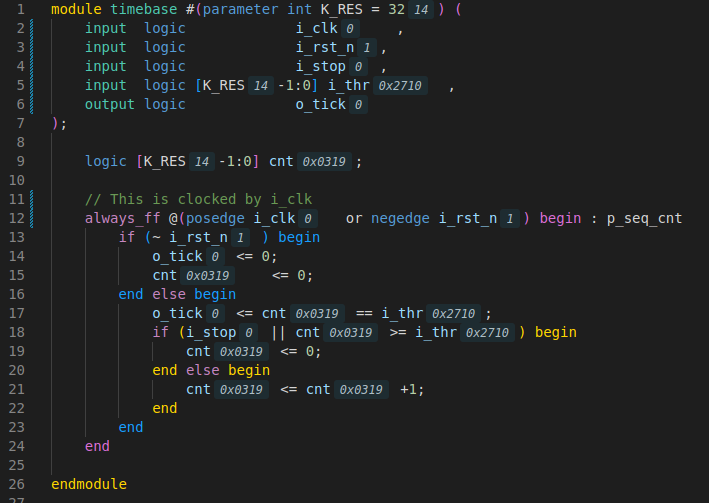
Editor with inline value display enabled
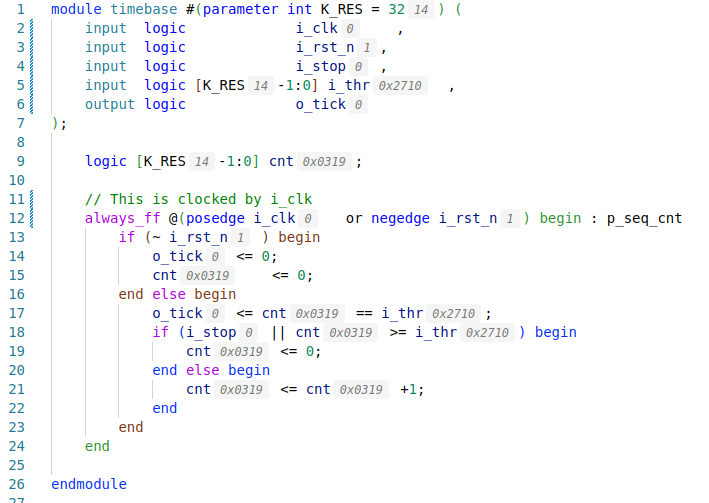
Editor with inline value display enabled
Note
As the value lookup is only meaninful in the context of the hierarchy, please navigate your design using the Hierarchy explorer while using the inline value display.
Adding signal to the waveform
When a point in the hierarchy is selected and the waveform viewer is opened, it is possible to add a signal
directly from the editor to the waveform viewer.
To do so, place your cursor to the desired symbol, right-click in the editor and select Add symbol to waveform .
Note
The waveform viewer must be opened for this option to show up.